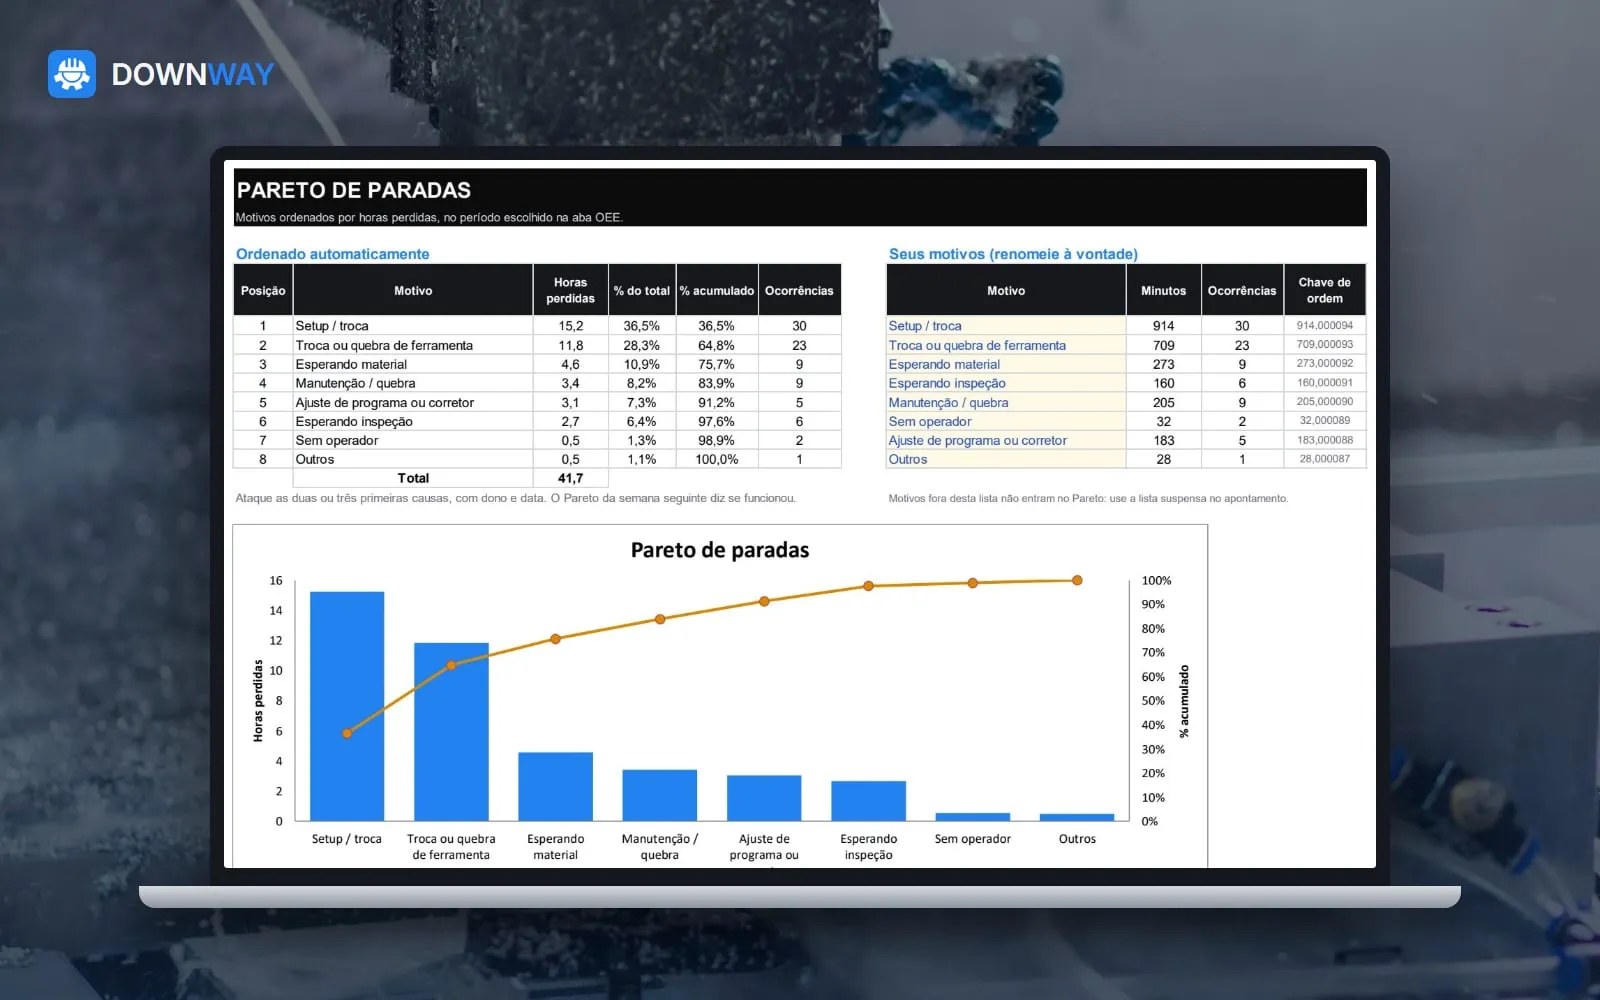
Excel that calculates OEE per machine and per day and builds the downtime Pareto by itself.
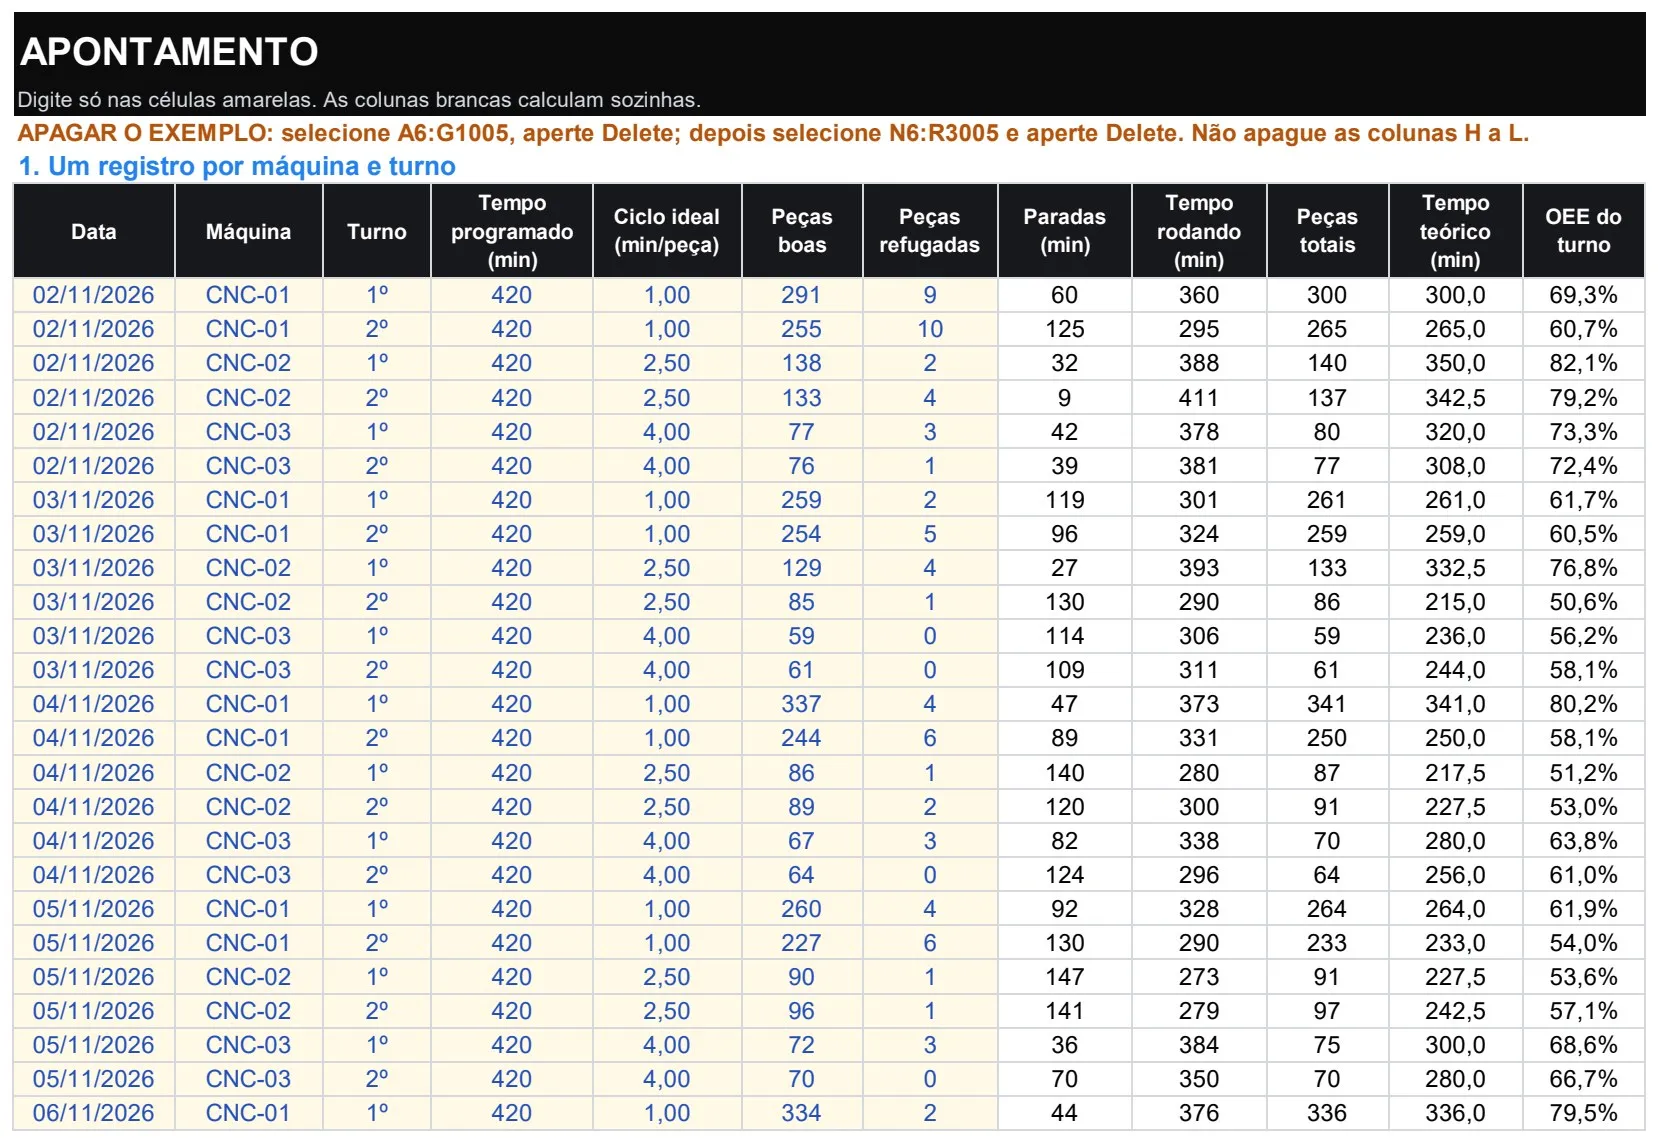
You log shifts and stops. The spreadsheet calculates availability, performance and quality, ranks the reasons by hours lost and draws the chart. Nothing to install and no macros.
What you get
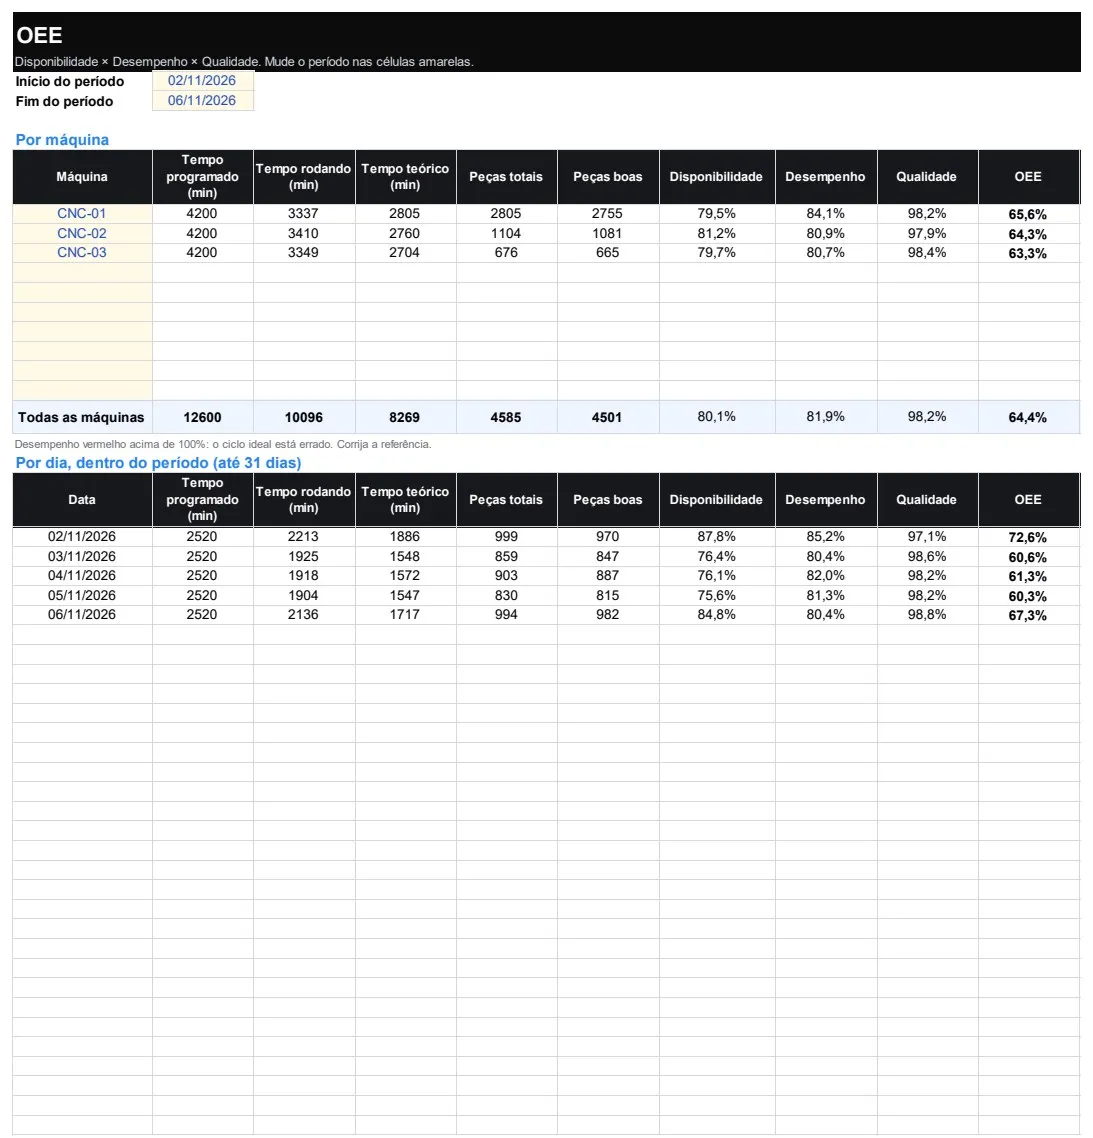
OEE per machine, per day and for any period you choose
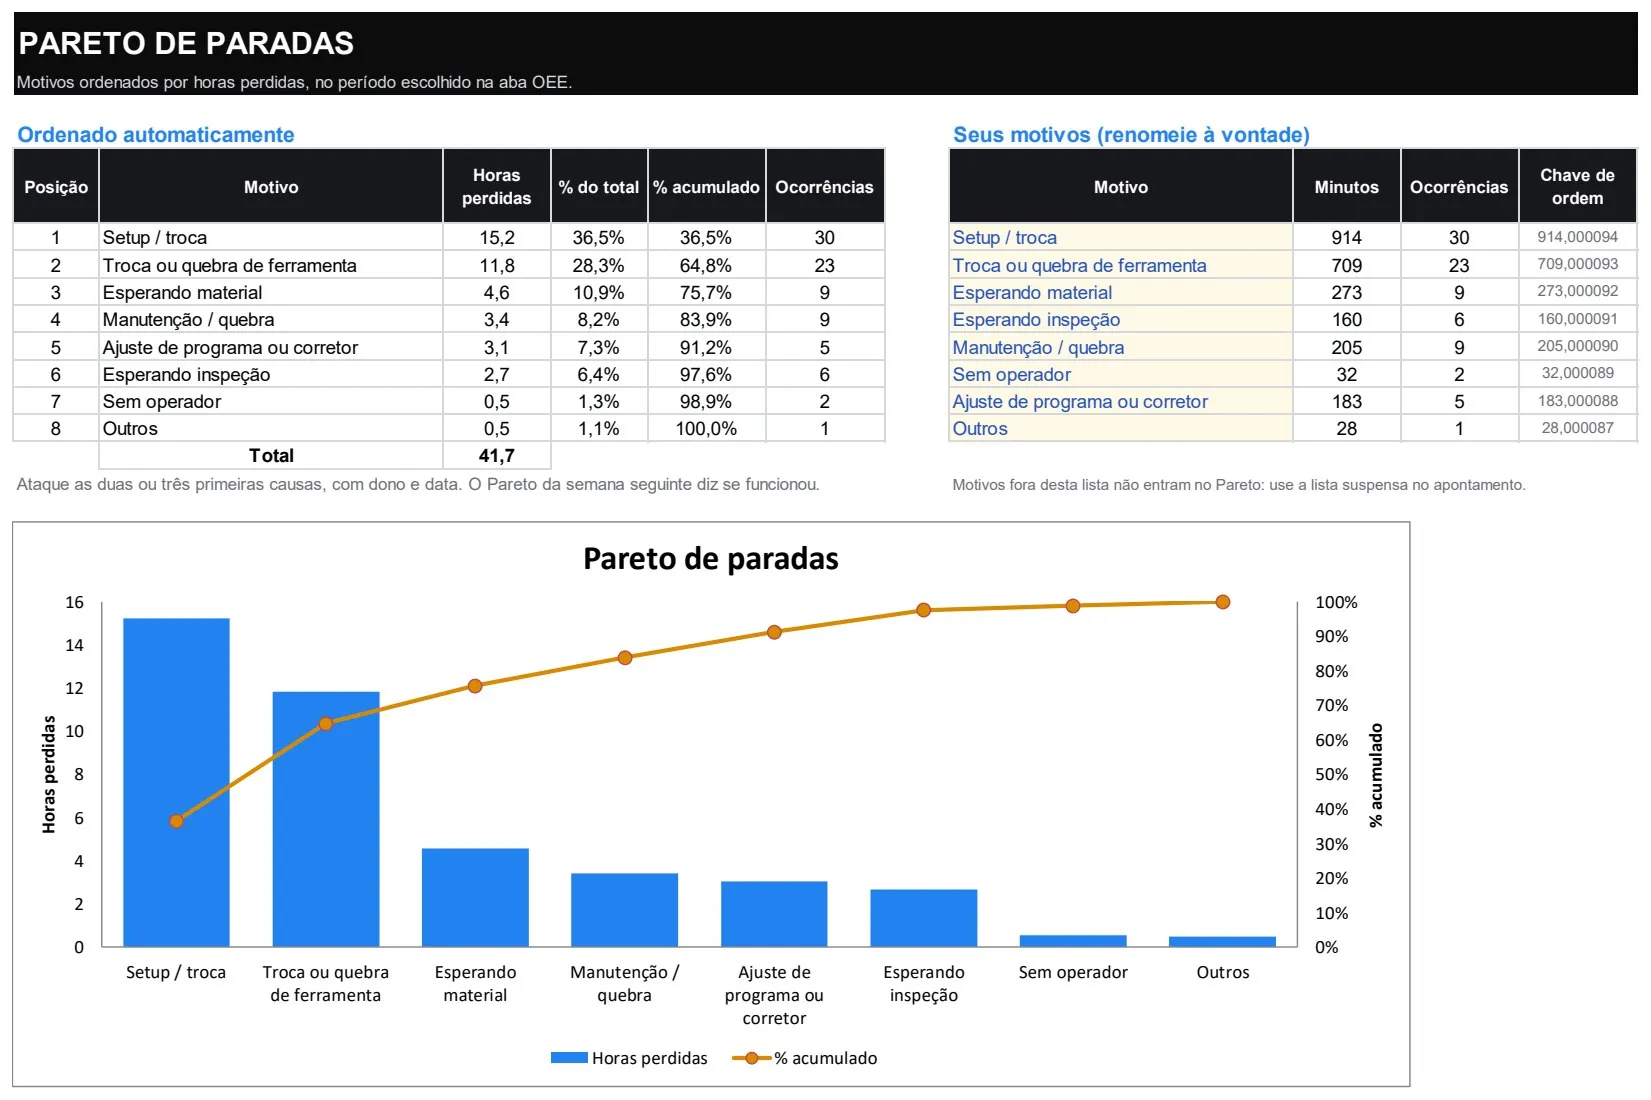
Automatic downtime Pareto with chart and cumulative percentage
Open formulas that really calculate in the cells
Drop-down lists so every entry is logged the same way
Product video (Portuguese narration)
Preview
Pareto tab: reasons by hours lost, with chartOEE tab: per machine and per day, for the chosen periodLog tab: fictitious sample data
Who it's for
You know the machines stop, but not why
Improvement projects are picked by opinion, not data
You want to start measuring before investing in automatic monitoring
Send us one drawing
We return a review with issues found, suggested fixes and a fixed-price scope. Free, under NDA if you need one.