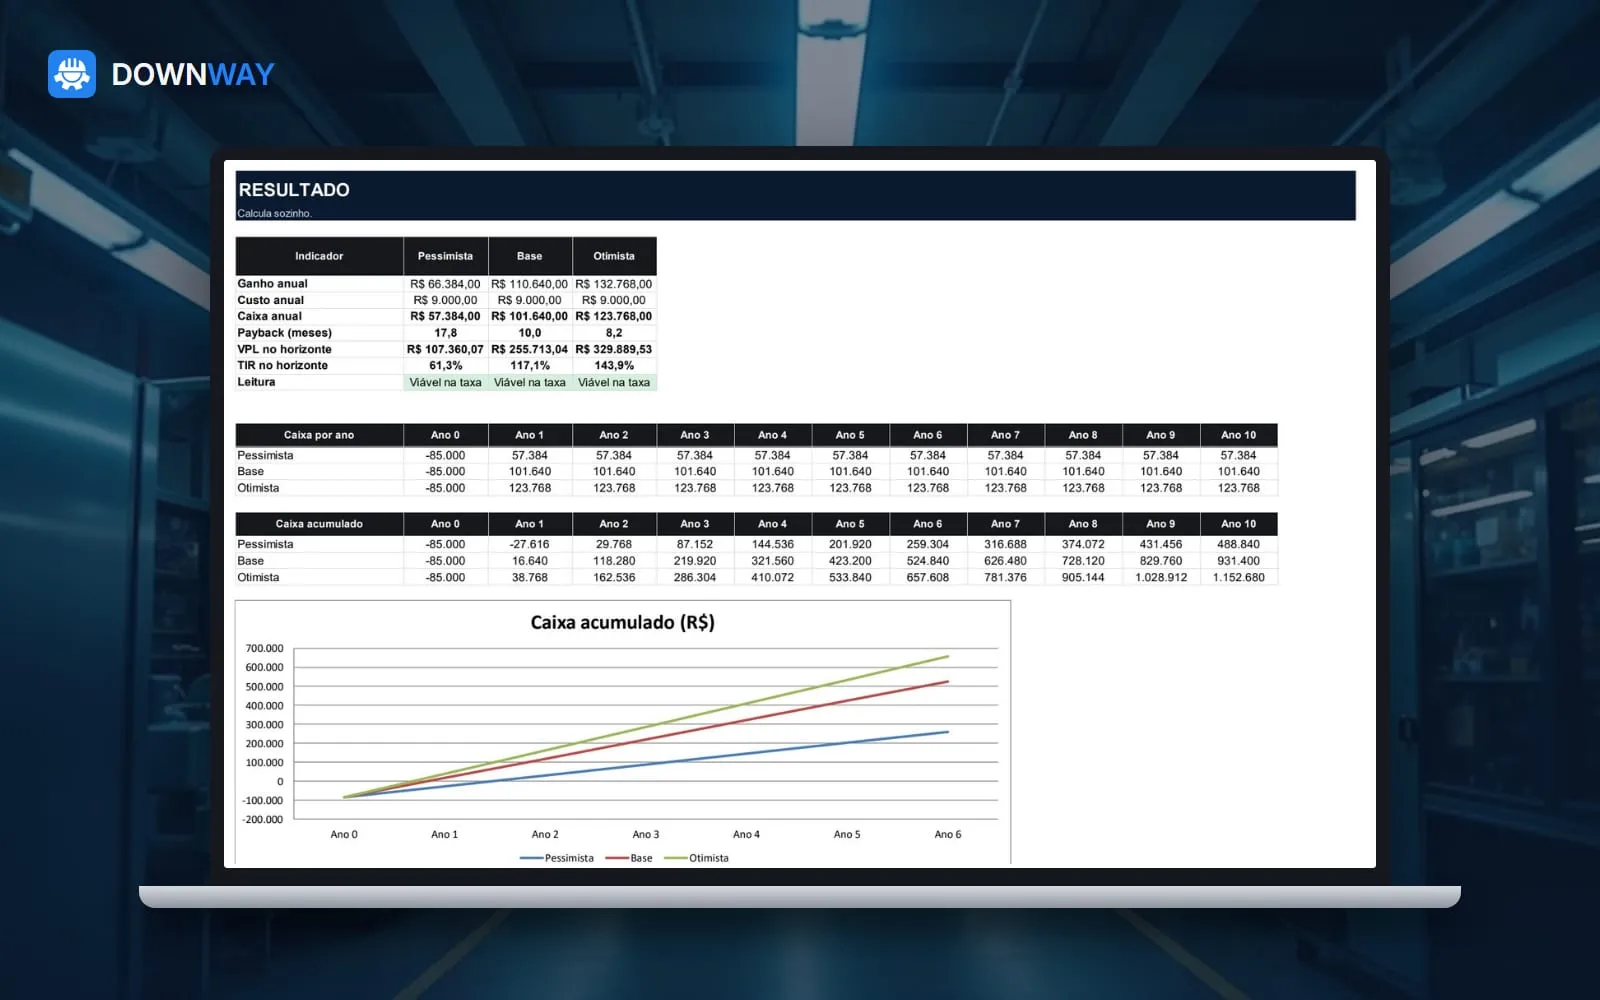
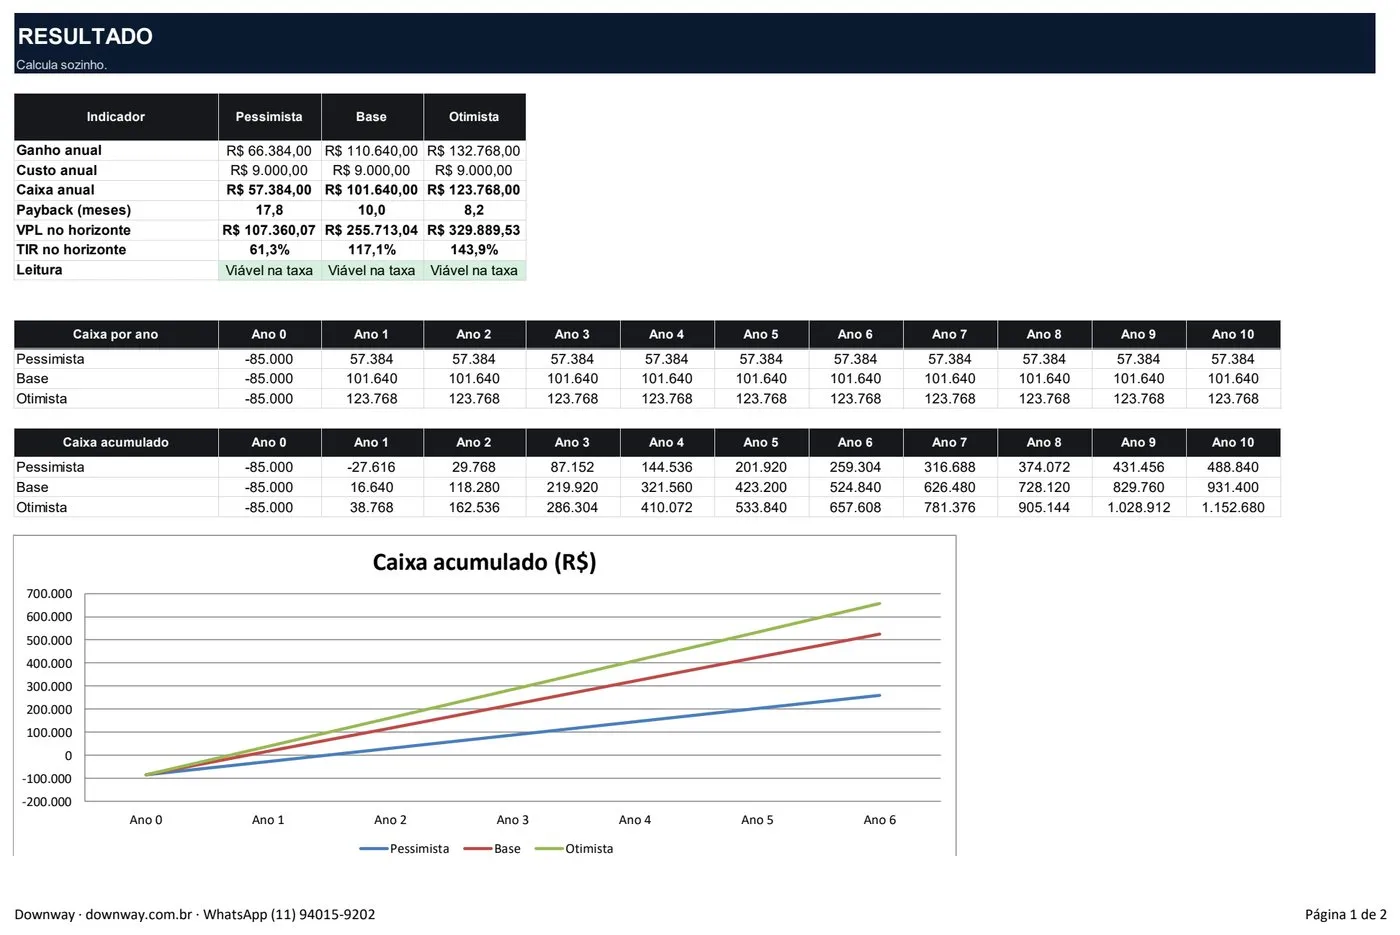
Payback, NPV and IRR in three scenarios, with a cumulative cash chart for management.
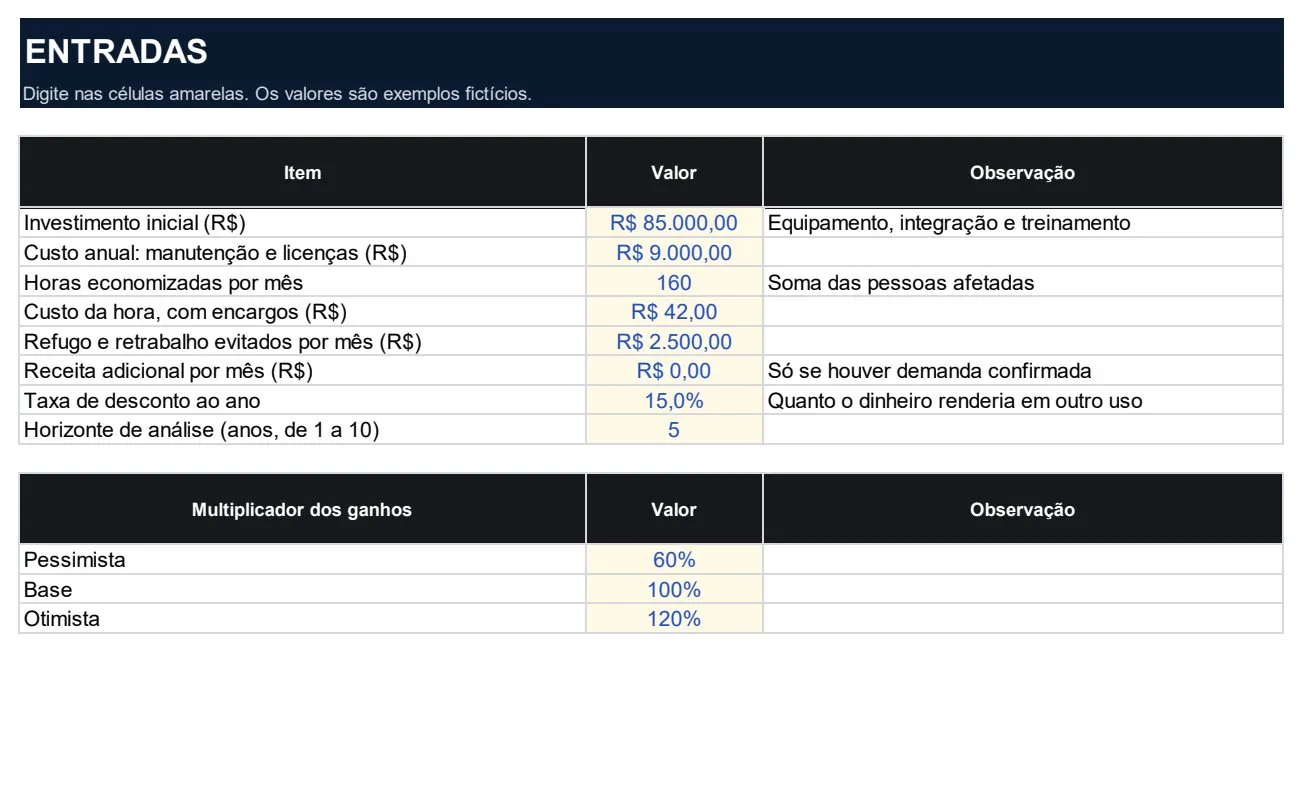
Enter the investment, yearly costs and monthly gain. The spreadsheet calculates payback, NPV and IRR in pessimistic, base and optimistic scenarios and shows when cumulative cash turns positive.
What you get
Payback, NPV and IRR calculated in Excel
Three scenarios with adjustable multipliers
Analysis horizon from 1 to 10 years
Chart ready for the presentation
Product video (Portuguese narration)
Preview
Results tab: fictitious exampleInputs tab: the project assumptions
Who it's for
You need to justify an automation investment
You want to compare supplier proposals
You are evaluating a robot, software or monitoring system
Send us one drawing
We return a review with issues found, suggested fixes and a fixed-price scope. Free, under NDA if you need one.